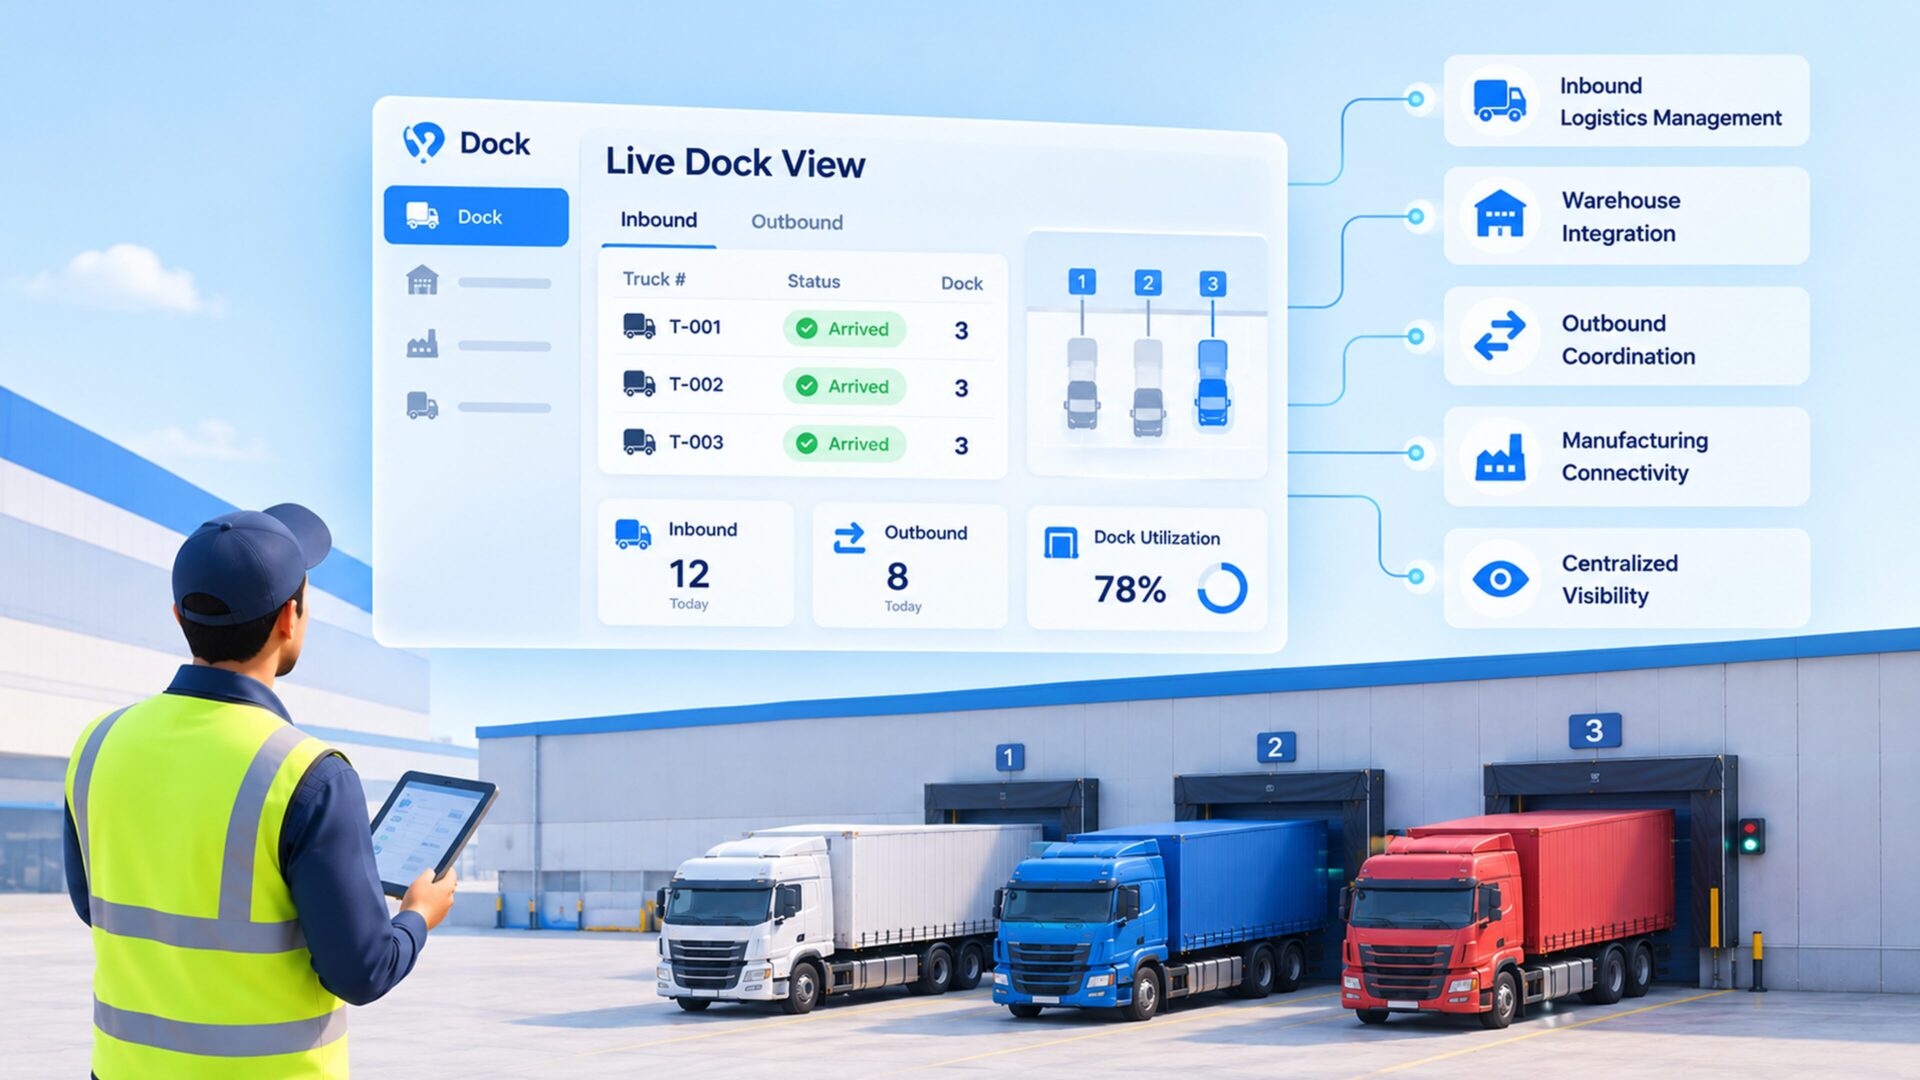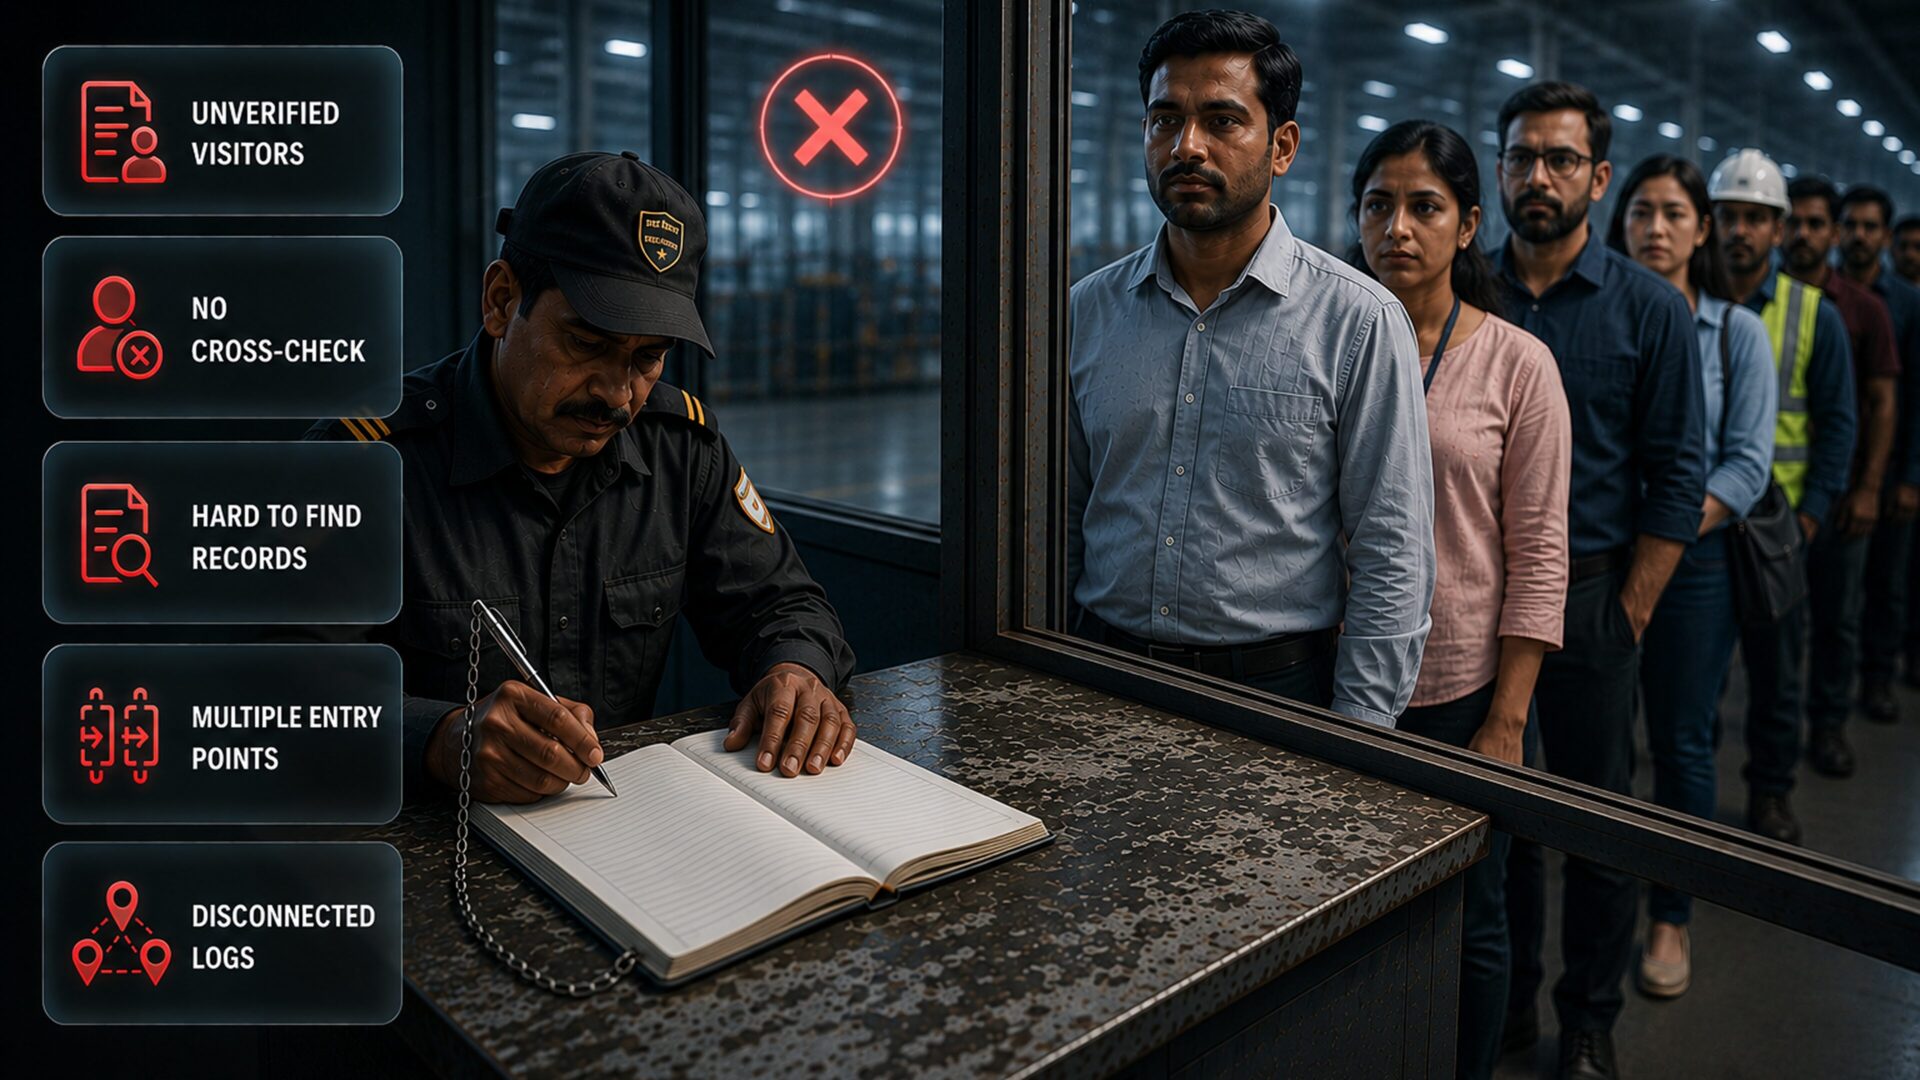

Introduction
In modern operations, data is essential for making better decisions.
But many operations teams spend more time collecting and organizing data than actually using it to improve processes.
Managers often depend on multiple Excel sheets, manual updates, and information collected from different departments to understand daily operations.
By the time reports are prepared, the situation may have already changed.
The challenge is not the lack of data.
The challenge is having the right information at the right time.
The Problem: Too Much Time Spent on Manual Data Collection
Multiple Excel Files Create Data Silos
Many organizations track operations through separate spreadsheets for:
1. Vehicle movements
2. Warehouse activities
3. Employee updates
4. Daily performance reports
5. Operational issues
Since data comes from different sources, teams spend hours combining information before they can analyze it.
This creates delays and increases the chance of errors.
Manual Updates Lead to Outdated Information
When reports depend on manual updates, the information is often not real-time.
Managers may make decisions based on:
1. Old reports
2. Incomplete information
3. Delayed updates
A problem that exists today may only become visible during tomorrow’s review.
Teams React to Problems Instead of Preventing Them
Without live operational insights, managers usually discover issues after they happen.
For example:
1. A vehicle delay is noticed after shipment disruption
2. A productivity issue is identified after performance drops
3. A bottleneck is discovered after delays increase
This creates a reactive approach where teams spend more time solving problems than improving processes.
Impact of Manual Reporting Processes
Slow Decision-Making
When leaders need information, they have to wait for teams to collect and prepare reports.
This slows down important decisions related to:
1. Resource allocation
2. Process improvements
3. Operational planning
Lack of Real-Time Visibility
Without a centralized view, managers cannot quickly understand:
1. Current operational status
2. Ongoing delays
3. Performance trends
4. Areas needing attention
Reduced Operational Efficiency
When teams spend hours preparing reports, less time is available for:
1. Process optimization
2. Problem-solving
3. Improving productivity
Solution: Real-Time Analytics Dashboard
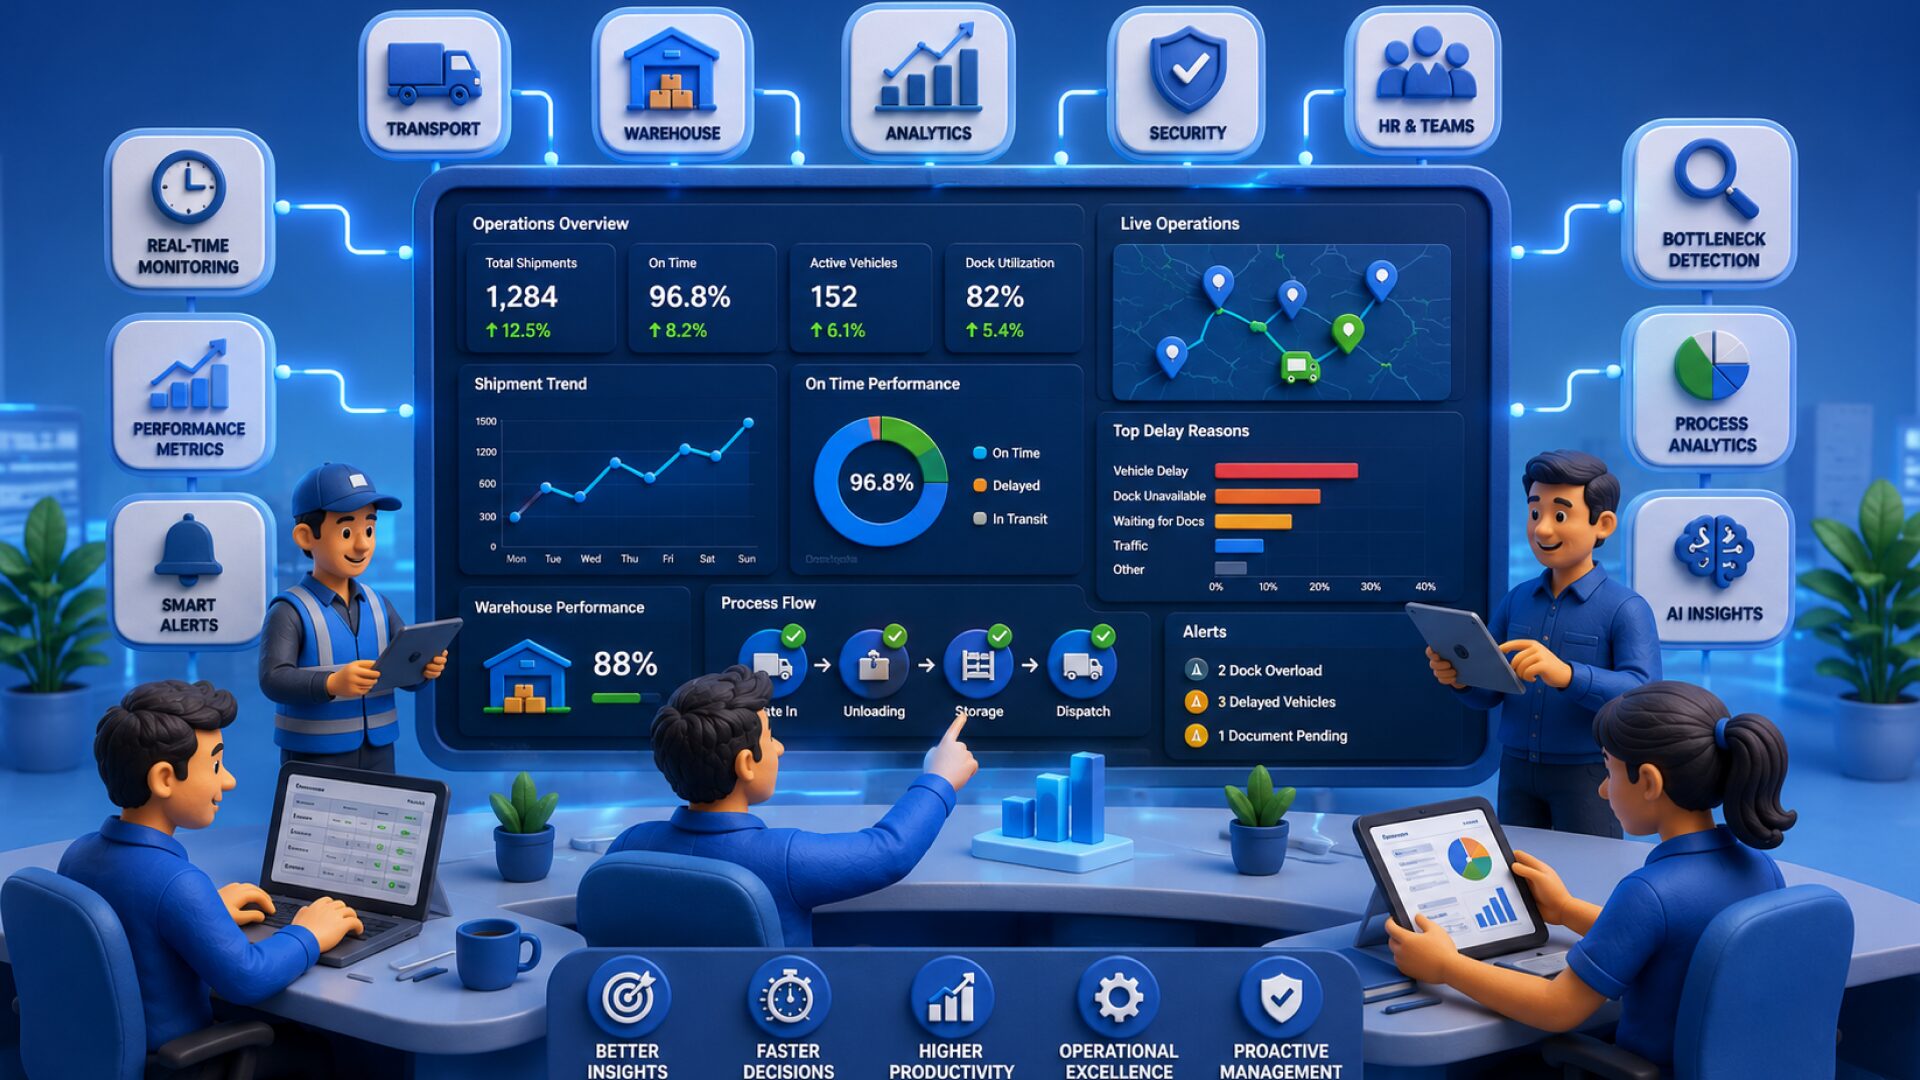
A centralized analytics dashboard transforms operational data into actionable insights.
Instead of collecting information manually, teams can access real-time visibility into daily operations.
A smart dashboard helps monitor:
1. Live operational status
2. Performance reports
3. Process trends
4. Productivity metrics
5. Bottleneck identification
With accurate data available instantly, managers can focus on improving operations rather than preparing reports.
How the Mawalog Analytics Dashboard Helps
Mawalog helps businesses turn operational data into meaningful insights.
With the Mawalog Analytics Dashboard, teams can:
1. View real-time operational performance
2. Monitor key business metrics
3. Identify delays and inefficiencies
4. Analyze trends over time
5. Make faster, data-driven decisions
By connecting information from different operational areas, Mawalog provides a complete view of what is happening across the business.
Conclusion
Operations teams should spend their time improving processes — not collecting data.
When information is scattered across spreadsheets and manual reports, businesses lose valuable time and opportunities.
With real-time dashboards and analytics, companies can move from reactive management to proactive decision-making.
Better insights. Faster decisions. Smarter operations.